ScaleSeeProduct story · 4 min read
How much bigger? Show the difference.
A visual comparison tool that turns quantities into scenes while keeping the meaning of scale explicit.
Read the case study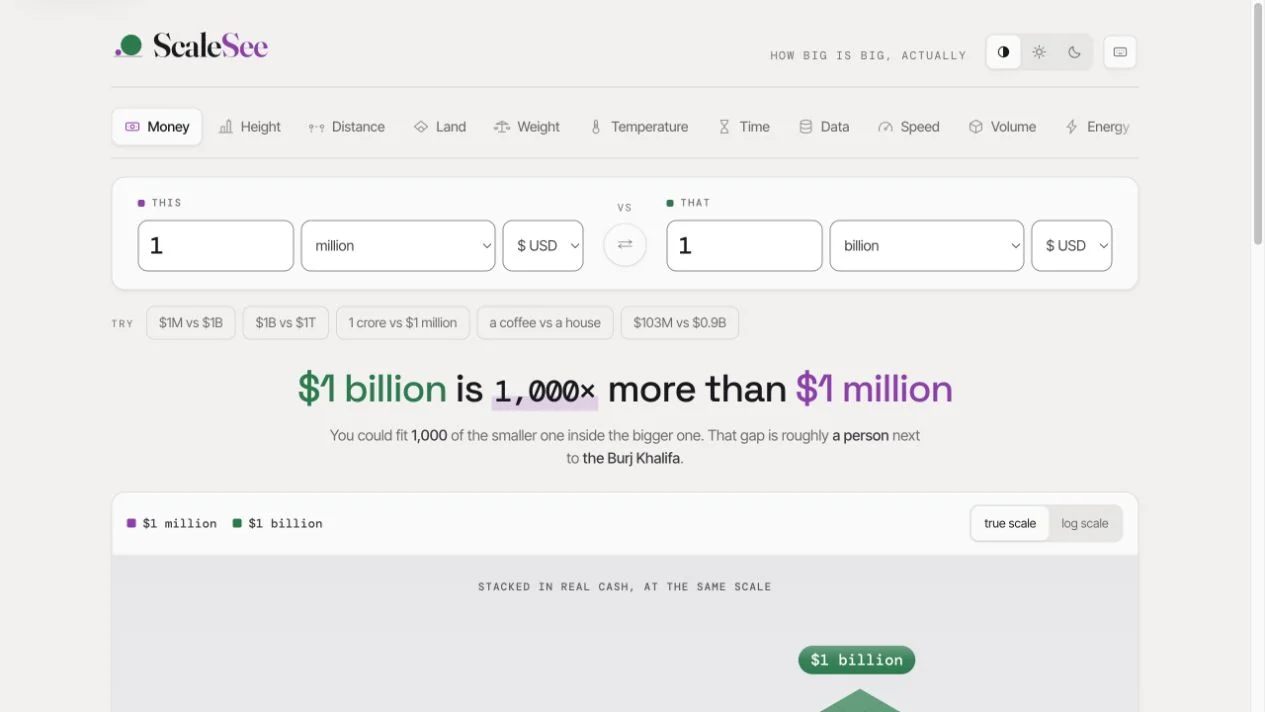
Original ScaleSee comparison surface, with two quantities drawn against the same scale.
View full size ↗01 The problem
When does making both quantities visible change the meaning of the picture?
A ratio can be mathematically clear and still be difficult to picture. ScaleSee turns two quantities into a shared visual comparison, choosing a representation that fits the kind of quantity instead of using the same chart for everything.
Designed for Person trying to explain a large difference. Understand the ratio and share it without losing context.
User context Design assumption
Comparing two quantities for a conversation or illustration.
- The friction
- Extreme differences make small values disappear or invite misleading compression.
- Design implication
- Declare scale changes and preserve labels in exports.
Example situation · illustrative scenario. Imagine comparing a million with a billion. The arithmetic is simple; making the difference feel concrete is another task.
02 The direction
The reference does the explaining
Legibility and proportional truth can pull apart. True scale may make one quantity almost disappear; a logarithmic view needs to declare its transformation.
Product artifact · comparison and export
My direction. I used category-specific scenes and explicit scale modes, with enough context to travel in a shared image.
Process and product scope
I selected a visual reference appropriate to each kind of quantity: a ground line for height, nesting for land, or a shared course for speed. The reference is part of the explanation.
An extreme ratio creates a useful design tension: showing true scale can make one quantity nearly disappear. A compressed alternative needs an explicit label that remains with a shared comparison or exported image.
- 11
- categories listed in the source
- 2
- scale modes
- Shareable
- comparison URLs
- Compare
Choose quantities of the same kind.
- See
Use a scene that fits the quantity.
- Interpret
Understand the selected scale mode.
- Share
Carry the labels and context into the output.
03 The outcome
Two quantities. One understandable relationship.
I matched comparison scenes to the quantity being explored and kept the scale mode explicit. Sharing and image export let a comparison leave the tool with its context. Extreme ratios still need testing for correct interpretation.
More about the experience
- A scene for the quantity. The product gives a ratio a concrete visual reference.
- Context travels with it. Scale, units, and assumptions matter in an exported comparison.
04 Design decisions
Choose a reference people can understand.
Open a decision to see the reasoning and trade-off.
01Choose the picture to fit the quantity
Height shares a ground line, land can be nested, and speed uses a common course.
Why this matters. A meaningful reference can make a ratio easier to interpret than a generic bar.
The trade-off. Every visual metaphor introduces assumptions; those assumptions need to be stated where they affect the comparison.
02Keep scale transformations explicit
True scale and logarithmic scale are separate modes.
Why this matters. When a small quantity almost disappears, that can be the honest answer; a compressed alternative should declare the change.
The trade-off. A log view can make a scene more legible while reducing intuitive proportionality.
03Let the comparison leave the tool
A URL carries the selected comparison and an image export preserves the current drawing.
Why this matters. An explanation is more useful when someone can bring it into the conversation that prompted it.
The trade-off. An exported image needs labels and scale context because it no longer has interactive controls beside it.
05 Reflection
An explanation should keep its assumptions visible when it leaves the tool.
Sometimes a proportional picture is too small to read and an adjusted view is easy to misread. I would check whether someone can identify the scale mode and explain what the picture does to the original numbers.
What I would evaluate next proposed work
- ask readers to estimate the ratio before and after each view, including an extreme comparison and a logarithmic one.
- Proposed check: confirm labels, units, assumptions, and scale mode survive in every shared or exported artifact.
Where would this place be as the plates move?